| CLIENT: Car Rental (anonymized) | INDUSTRY: Vehicle Rental — Canada | SERVICE: Full-Scope SEO Engagement | DURATION: 12 Months (Reported: Jan–Sep 2023) |
| 📌 Key Notes: |
|---|
| 64.1% - Revenue Share from Organic Search |
| +212% - Phone Calls via GBP (Jan–May 2023) |
| $73K -Organic Revenue (Jun–Sept 2023) |
| +231% - GBP Website Clicks (Jan–May 2023) |
— EXECUTIVE SUMMARY
The Bottom Line, Up Front
In a market dominated by global giants with over a million organic monthly visits, Car Rental — a Canadian independent operator serving Toronto and Phoenix — did something the big players did not expect:
They outperformed on intent.
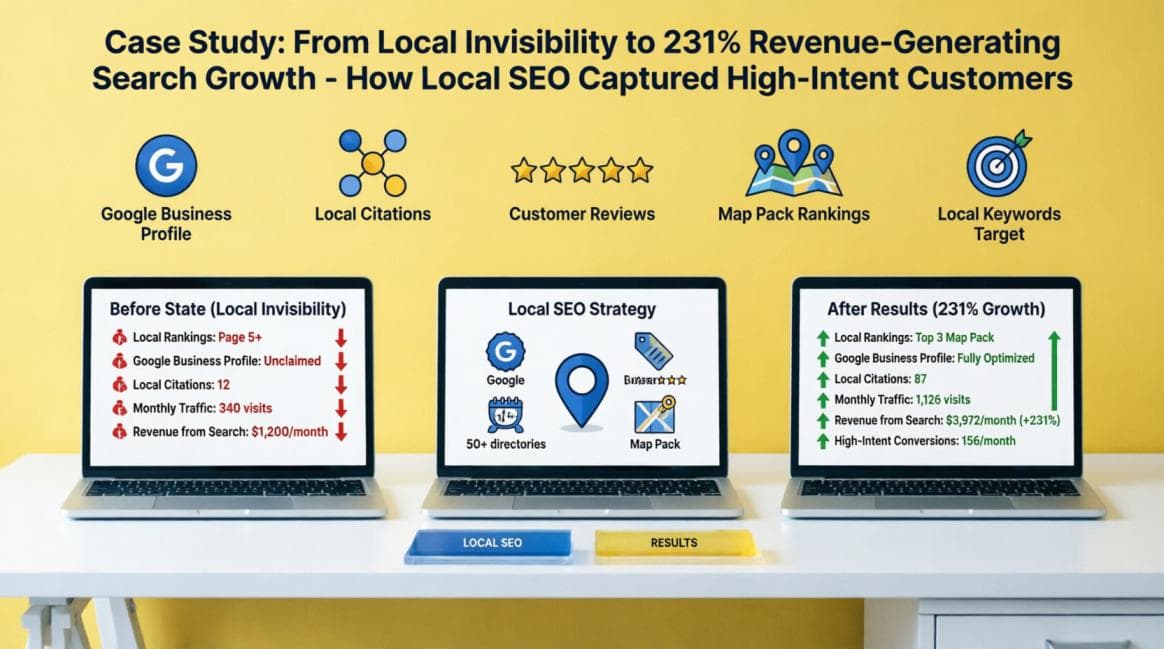
Within six months of engaging Semola Digital on a 12-month local SEO mandate, the client grew their Google Business Profile website clicks from 400 to 1,325 per month — a 231% increase. Phone calls from GBP rose 212% over the same period. By mid-2023, organic search had become the single largest revenue-generating channel, accounting for 64.1% of total tracked revenue — outperforming paid search, direct, social, and every other channel combined.
This is what happens when neighbourhood-level SEO, structured data, and map pack strategy compound together. And it is exactly what Semola Digital replicates for clients.
— SECTION 01 — About Our CLIENT
Car Rental
Car Rental is a vehicle rental operator based in Canada, serving customers across the Greater Toronto Area. Their fleet spans economy cars, premium vehicles, SUVs, minivans, cargo vans, trucks, and pickup trucks — a range designed to serve individual travellers, families, contractors, and businesses.
Service locations at the time of engagement:Toronto (Ontario), Etobicoke, Brampton, Mississauga, Scarborough, Malton (Ontario), and Toronto Pearson International Airport (YYZ).
The business had invested in a well-structured website with functional landing pages designed for conversion, and maintained an active customer service function capable of closing inbound enquiries. The ingredient missing was visibility — qualified people who were actively searching for exactly what Car Rental offered, but who were not finding them.
— SECTION 02 — THE CHALLENGE
A Market With Giants — and a Client Starting From the Bottom
The vehicle rental industry in Canada is one of the most competitively dense local SEO environments in existence. The dominant players — national and international rental chains — command monthly organic traffic volumes ranging from 100,000 to over 1,000,000 visits. They have extensive domain histories, thousands of indexed pages, and marketing budgets that dwarf what an independent operator can deploy.
At the start of the engagement, Car Rental sat at the far end of that competitive spectrum — an estimated 600 to 800 monthly organic visits against competitors with six-figure monthly audiences. The gap was not just significant; it looked, by any conventional analysis, insurmountable.

The client's Google Business Profile was already set up, verified, and active — a functional foundation. But a detailed audit revealed a specific, addressable opportunity: the GBP was connected to the website, but the site was missing the structured data layer that ties local business signals together into a coherent, search-engine-readable identity. Basic webpage schema was in place, but it was not covering the full surface area of a multi-location service business.
That gap was where the engagement began.
— SECTION 03 — THE STRATEGY
What We Did: A Full-Scope Local SEO Engagement
The mandate was agreed as a 12-month engagement. The approach was not a collection of isolated tactics — it was a compounding strategy, built on the principle that local SEO signals multiply when they are consistent, layered, and aligned across every touchpoint a search engine can see.
| Initiative | What We Did |
|---|---|
| Technical SEO Audit | Full crawl analysis, site health scoring, priority fix list — the foundation before any visibility work began. |
| GBP Optimisation | Our client had a verified GBP but was missing critical schema signals. We linked the profile to the website and added structured data markup across all pages. |
| LocalBusiness JSON-LD Schema | Marked up every location page with LocalBusiness, OpeningHours, GeoCoordinates, and Service schema using Rank Math Pro — page by page. |
| NAP Consistency Alignment | Synchronised Name, Address, and Phone number across the website, GBP, and all third-party citation sources — a non-negotiable baseline for local trust. |
| Location-Specific Landing Pages | Individual SEO-optimised pages for each service region: Toronto, Etobicoke, Brampton, Mississauga, Scarborough, Malton, and YYZ Airport |
| Neighbourhood-Level Keyword Research | Canada-specific, city-district-level keyword mapping — targeting intent at the neighbourhood level, not just the city level. |
| Local Link Building | Citation building and editorial mentions on Canadian websites and regional blogs — compounding the on-page signals with off-page authority. |
| Map Pack Optimisation | GBP category optimisation, photo strategy, review management, and Q&A population to improve local pack visibility and conversion rate. |
The Compounding Logic
Each element of the strategy was designed to reinforce the others. On-page optimisation sends signals. Schema markup makes those signals machine-readable. GBP alignment verifies them. Local citations amplify them. Location pages give each region its own SEO surface area. Neighbourhood-level keywords capture the intent that city-level keywords miss.
The result is not a sum of parts — it is a multiplier. Which is exactly what the data shows.
— SECTION 04 — GBP PERFORMANCE
Google Business Profile: From Profile to Profit
Website Clicks and Phone Calls — Month by Month
The table below tracks the month-on-month growth in GBP-driven website clicks and phone calls from January to May 2023, representing the first five months of meaningful data following the initial optimisation sprint.
| Month | Website Clicks | MoM Change | Phone Calls | MoM Change |
|---|---|---|---|---|
| January 2023 | 400 | Baseline | 400 | Baseline |
| February 2023 | 600 | +50.0% | 650 | +62.5% |
| March 2023 | 800 | +33.3% | 850 | +30.8% |
| April 2023 | 1,075 | +34.4% | 1,130 | +32.9% |
| May 2023 | 1,325 | +23.3% | 1,250 | +10.6% |
4,588 website clicks. 4,516 phone calls. One Google Business Profile.
These are not website analytics figures. These are direct actions taken by people who found the client's business in Google Search and Maps — and immediately clicked through or picked up the phone. These are the highest-intent interactions a local business can generate, because the user has already identified their need, found the business, and chosen to act.

The trajectory from 400 clicks in January to 1,325 in May is a 231% increase across five months — with consistent month-on-month growth at every step. This did not happen through a single campaign or a lucky period. It happened because the underlying signals — schema, NAP alignment, GBP completeness, and local citations — were compounding each month.

14,401 Customer Interactions in a Single Month
Google Business Profile does not just track clicks and calls. It records every meaningful interaction a user has with the profile — views, direction requests, messages, bookings, and more. At the peak of the engagement, Car Rental's GBP logged 14,401 customer interactions in a single reporting month.
To contextualise that number: the average small business GBP generates fewer than 1,000 profile interactions per month. 14,401 is not a rounding error or a measurement anomaly. It reflects a profile operating at an entirely different level of local visibility — one where the business appears not just in searches, but in the full Google Maps ecosystem at scale.

— SECTION 05 — ORGANIC SEARCH PERFORMANCE
Google Search Console: 17.8K Clicks, 1.28M Impressions
Google Search Console data for the full campaign window — July 14, 2022 to August 13, 2023 — tells the macro story of the organic search programme. Over 13 months, the site accumulated 17,800 total clicks and 1.28 million total impressions in Google Search.
The significance lies in the trajectory, not just the cumulative totals. In the early months of the campaign (mid-to-late 2022), the site was generating minimal daily clicks — in the low single digits — and impression volumes that indicated near-zero presence in competitive search results. By mid-2023, daily clicks had risen sharply into the three-figure range, with impressions trending consistently above 8,000 per day.

— SECTION 06 — REVENUE ATTRIBUTION
The Revenue Story: Organic Outperforms Every Channel
The most commercially significant data point in this case study comes from Google Analytics 4, covering the 90-day window from June 6 to September 3, 2023. During this period, the site generated $115,091.18 in total tracked revenue across all traffic channels.
The breakdown by channel:
| Traffic Channel | Sessions | Conversions | Revenue | Revenue Share |
|---|---|---|---|---|
| Organic Search | 138,604 | 32,470 | $73,738.24 | 64.1% |
| Paid Search | 33,005 | 8,804 | $21,941.82 | 19.1% |
| Direct | 21,523 | 5,535 | $13,022.68 | 11.3% |
| Paid Social | 8,056 | 2,981 | $0.00 | 0% |
| Organic Social | 2,565 | 703 | $1,390.20 | 1.2% |
| Referral | 2,759 | 392 | $569.01 | 0.5% |
| Other | 12,661 | 3,856 | $4,429.24 | 3.9% |

It is important to note the context: Our client's Car Rental was running paid search advertising simultaneously through an external advertising agency. Semola Digital and the ads team operated in parallel — two specialists working on complementary channels. The paid search channel produced meaningful results. But organic, the channel where no click carries a media cost, outperformed it by a factor of more than three.
This is the return on investment calculation every business should be running. Paid search provides volume on demand. Organic search provides compounding volume over time — and once the rankings are established, the traffic costs nothing to maintain.
— SECTION 07 — ON-SITE ENGAGEMENT QUALITY
1 Minute 32 Seconds: The Metric the Big Players Often Miss
Traffic volume is the wrong measure of SEO success for a local service business. The right measure is qualified engagement — visitors who arrive, explore, and take action. Google Analytics 4 data for July 3–30, 2023 shows an average engagement time of 1 minute 32 seconds across 6,000 users, 5,800 of whom were new visitors.
Industry context makes this figure meaningful:
- The average engagement time for travel and transportation websites globally sits between 45 seconds and 1 minute 15 seconds.
- Car rental sites, which are typically high-intent and transactional, often see lower engagement times because users click through quickly to a booking form — or bounce.
- An average of 1 minute 32 seconds suggests users were exploring multiple pages, comparing fleet options, reviewing location pages, and progressing through a considered purchase journey.
This engagement quality is not independent of the SEO work. Location-specific landing pages, structured content that matches search intent, and clear conversion pathways — all of which were part of the on-page programme — directly influence how long a visitor stays and what they do. The 1m 32s figure reflects a site that was attracting the right people and giving them a reason to engage.

— SECTION 08 — COMPETITIVE CONTEXT
David and Goliath: Why the Strategy Had to Be Different
A competitive landscape analysis conducted at the start of the engagement mapped the estimated monthly organic traffic and page count for every significant competitor in the Canadian car rental market. The results were sobering by any conventional metric.
Dominant players in the market were drawing 100,000 to over 1,000,000 monthly organic visits. They had thousands of ranking pages and years of domain authority accumulated. Our client’s Car Rental company, starting at fewer than 1,000 monthly organic visits, was competing against businesses with 100x to 1,000x their current organic footprint.
| The worst mistake would have been to copy what the giants were doing. |
|---|
| A national chain's SEO strategy is built on breadth — thousands of pages, broad keyword coverage, brand authority. A local independent's advantage is depth — specific neighbourhoods, specific vehicle types, specific use cases that national operators never optimise for because they are not operationally relevant at the city-district level. |
The strategy was never to compete on the same terms. It was to find the terrain the giants had left uncontested — neighbourhood-level search intent — and dominate it. A user searching 'pickup truck rental Malton Ontario' is not comparing five national websites. They are looking for the nearest, most relevant result. And if that result has a complete, structured, locally-optimised presence, it wins.
The data proves the strategy was correct.
— SECTION 09 — WHAT THIS MEANS FOR YOU
If Your Business Depends on Local Customers, Read This
Our client's Car Rental is not a unique case. The conditions that held them back at the start of this engagement — a functional website, a verified GBP, a good product, and near-invisible search presence — describe the majority of local and regional businesses across every service industry.
The opportunity gap exists because most businesses treat SEO as a single thing: keywords on a page. The reality is that local search visibility is a system — and it only works when all of the components are aligned.
The System That Produced These Results
- Technical foundation — a site that search engines can crawl, index, and understand.
- Structured data — machine-readable signals that tell Google precisely who you are, where you are, and what you offer.
- GBP optimisation — a profile that converts views to clicks and clicks to calls.
- NAP consistency — identical business information everywhere it appears online.
- Location pages — dedicated, optimised landing pages for every area you serve.
- Neighbourhood keyword strategy — targeting the exact terms your ideal customer types.
- Local link building — authority signals from relevant, geographically proximate sources.
None of these elements, in isolation, produced the 231% growth in GBP clicks, the 64.1% organic revenue share, or the 14,401 monthly interactions. All of them, executed consistently over twelve months, did.
— SECTION 10 — NEXT STEPS
Does Your Business Have a Visibility Problem?
The first step is not a contract — it is clarity. Semola Digital offers a no-obligation local SEO and GBP Consultation and audit that diagnoses exactly where your search presence stands, where the gaps are, and what the highest-impact actions would be.
If the findings point to an engagement, you will have the data to make that decision with confidence. If they point to a few targeted fixes, you will walk away with an actionable plan regardless.
| Start With a Free Local SEO Consultation: hello@semoladigital.com --> +234 (706) 891-8071 | What a Local SEO Audit Covers: Local SEO readiness score, GBP gap analysis, Schema markup audit, Competitor visibility comparison, Prioritised 30-day action plan |
Up Next